前言
最近研究图像重建老是看到SSIM损失函数,但是去找了那篇论文《Image Quality Assessment: From Error Visibility to Structural Similarity》挺有意思的。
Structural Similarity
作者把两幅图 x, y 的相似性按三个维度进行比较:亮度(luminance)l(x,y),对比度(contrast)c(x,y),和结构(structure)s(x,y)。最终 x 和 y 的相似度为这三者的函数:

其中l(x,y),c(x,y).s(x,y)三个公式定量计算这三者的相似性,公式的设计遵循三个原则:
1.对称性:
2.有界性 :
3.极值唯一 , 当且仅当 x = y
亮度相似性
如果一幅图有 N 个像素点,每个像素点的像素值为 xi,那么该图像的平均亮度为:

则两幅图 x 和 y 的亮度相似度:

这里 C1是为了防止分母为零的情况,且:

其中 K1<<1是一个常数,具体代码中的取值为 0.01,L 是灰度的动态范围,由图像的数据类型决定,如果数据为 uint8 型,则 L=255。可以看出,公式 (4) 对称且始终小于等于1,当 x = y时为1。
对比度相似性
所谓对比度,就是图像明暗的变化剧烈程度,也就是像素值的标准差。其计算公式为:

对比度的相似度公式和公式 (4) 极为相似,只不过把均值换成了方差,定义为:

其中:

K2一般在代码中取 0.03。公式 (7) 也对称且小于等于1,当 x = y 时等号成立.
结构相似度
需要注意的是,对一幅图而言,其亮度和对比度都是标量,而其结构显然无法用一个标量表示,而是应该用该图所有像素组成的向量来表示。同时,研究结构相似度时,应该排除亮度和对比度的影响,即排除均值和标准差的影响。归根结底,作者研究的是归一化的两个向量:

之间的关系。根据均值与标准差的关系,可知这两个向量的模长均为  因此它们的余弦相似度为:

上式中第二行括号内的部分为协方差公式:

同样为了防止分母为0,分子分母同时加 C3.
最终s(x,y)

令 c3=c2/2 , c(x,y)的分子和 s(x,y) 的分母可以约分,最终得到 SSIM 的公式:

SSIM 实现
然而,上面的 SSIM 不能用于一整幅图。因为在整幅图的跨度上,均值和方差往往变化剧烈;同时,图像上不同区块的失真程度也有可能不同,不能一概而论;此外类比人眼睛每次只能聚焦于一处的特点。作者采用 sliding window (这里可以看做卷积)以步长为 1 计算两幅图各个对应 sliding window 下的 patch 的 SSIM,然后取平均值作为两幅图整体的 SSIM,称为 Mean SSIM。简写为 MSSIM(注意和后续出现的 multi-scale SSIM:MS-SSIM 作区分)。
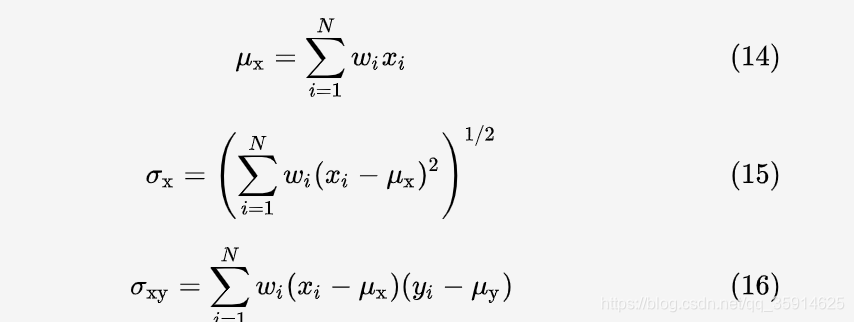
如果像素 Xi对应的高斯核权重为 Wi。那么加权均值,方差,协方差的公式为:

假如整幅图有 M 个 patch,那么 MSSIM 公式为:


在我们用pytorch实现部分

非加权平均包含在加权平均的情况之下,因此这里只推导加权的情况,若 wi 为权重,根据 (15):

想求图像的方差,只需做两次卷积,一次是对原图卷积,一次是对原图的平方卷积,然后用后者减去前者的平方即可。
根据 (16):

求两图的协方差,只需做三次卷积,第一次是对两图的乘积卷积,第二次和第三次分别对两图本身卷积,然后用第一次的卷积结果减去第二、三次卷积结果的乘积。
import torch
import torch.nn.functional as F
from torch.autograd import Variable
import numpy as np
from math import exp

def gaussian(window_size, sigma): gauss = torch.Tensor([exp(-(x - window_size//2)**2/float(2*sigma**2)) for x in range(window_size)]) return gauss/gauss.sum()

def create_window(window_size, channel): _1D_window = gaussian(window_size, 1.5).unsqueeze(1) _2D_window = _1D_window.mm(_1D_window.t()).float().unsqueeze(0).unsqueeze(0) window = Variable(_2D_window.expand(channel, 1, window_size, window_size).contiguous()) return window

def _ssim(img1, img2, window, window_size, channel, size_average = True): mu1 = F.conv2d(img1, window, padding = window_size//2, groups = channel) mu2 = F.conv2d(img2, window, padding = window_size//2, groups = channel) mu1_sq = mu1.pow(2) mu2_sq = mu2.pow(2) mu1_mu2 = mu1*mu2 sigma1_sq = F.conv2d(img1*img1, window, padding = window_size//2, groups = channel) - mu1_sq sigma2_sq = F.conv2d(img2*img2, window, padding = window_size//2, groups = channel) - mu2_sq sigma12 = F.conv2d(img1*img2, window, padding = window_size//2, groups = channel) - mu1_mu2 C1 = 0.01**2 C2 = 0.03**2 ssim_map = ((2*mu1_mu2 + C1)*(2*sigma12 + C2))/((mu1_sq + mu2_sq + C1)*(sigma1_sq + sigma2_sq + C2)) if size_average: return ssim_map.mean() else: return ssim_map.mean(1).mean(1).mean(1)

class SSIM(torch.nn.Module): def __init__(self, window_size = 11, size_average = True): super(SSIM, self).__init__() self.window_size = window_size self.size_average = size_average self.channel = 1 self.window = create_window(window_size, self.channel) def forward(self, img1, img2): (_, channel, _, _) = img1.size() if channel == self.channel and self.window.data.type() == img1.data.type(): window = self.window else: window = create_window(self.window_size, channel) if img1.is_cuda: window = window.cuda(img1.get_device()) window = window.type_as(img1) self.window = window self.channel = channel return _ssim(img1, img2, window, self.window_size, channel, self.size_average)

def ssim(img1, img2, window_size = 11, size_average = True): (_, channel, _, _) = img1.size() window = create_window(window_size, channel) if img1.is_cuda: window = window.cuda(img1.get_device()) window = window.type_as(img1) return _ssim(img1, img2, window, window_size, channel, size_average)
- 1
- 2
- 3
- 4
- 5
- 6
- 7
- 8
- 9
- 10
- 11
- 12
- 13
- 14
- 15
- 16
- 17
- 18
- 19
- 20
- 21
- 22
- 23
- 24
- 25
- 26
- 27
- 28
- 29
- 30
- 31
- 32
- 33
- 34
- 35
- 36
- 37
- 38
- 39
- 40
- 41
- 42
- 43
- 44
- 45
- 46
- 47
- 48
- 49
- 50
- 51
- 52
- 53
- 54
- 55
- 56
- 57
- 58
- 59
- 60
- 61
- 62
- 63
- 64
- 65
- 66
- 67
- 68
- 69
- 70
- 71
- 72
- 73
- 74
总结
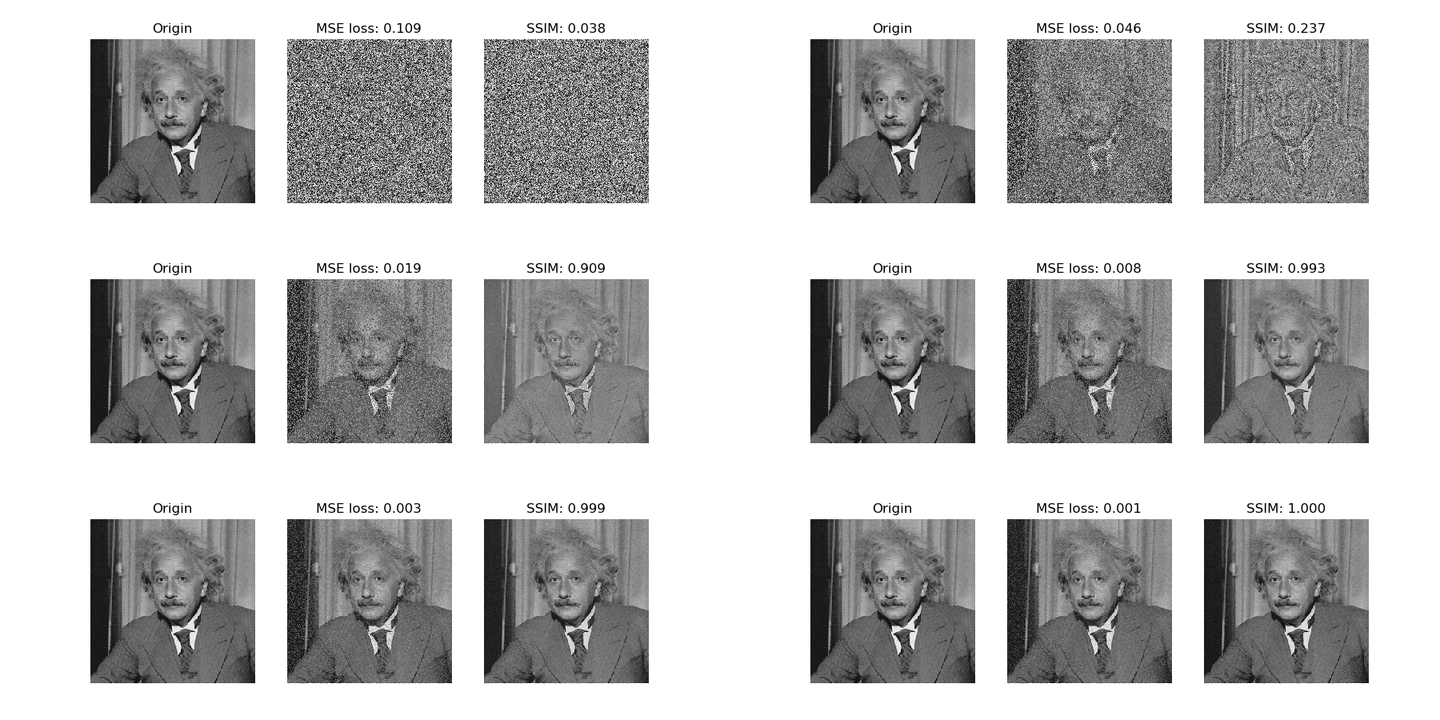
下面的 GIF 对比了 MSE loss 和 SSIM 的优化效果,最左侧为原始图片,中间和右边两个图用随机噪声初始化,然后分别用 MSE loss 和 -SSIM 作为损失函数,通过反向传播以及梯度下降法,优化噪声,最终重建输入图像。:

文章来源: blog.csdn.net,作者:快了的程序猿小可哥,版权归原作者所有,如需转载,请联系作者。
原文链接:blog.csdn.net/qq_35914625/article/details/113789903